1.3 KiB
1.3 KiB
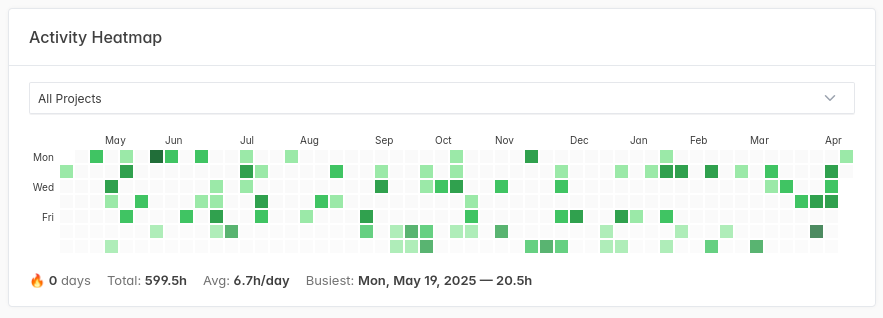
Kimai Heatmap Plugin
A GitHub-style activity heatmap for your Kimai dashboard. See where your time went at a glance.
Features
- Calendar heatmap showing daily tracked hours over the past year
- Project filter dropdown
- Click any day to jump to that day's timesheet
- Streak counter and summary stats (total hours, daily average, busiest day)
- Weekend visual distinction
- Respects your configured start-of-week preference
- Works with light and dark themes
- Responsive — scrollable on small screens, resizes with the browser
Installation
composer config repositories.heatmap vcs https://git.toph.so/toph/kimea-plugin-heatmap
composer require kimai-plugin/heatmap-bundle
bin/console kimai:reload
If you can't run composer require directly (e.g. Docker Compose, Nomad, or a custom image), add this to your composer.json instead:
{
    "repositories": [
        { "type": "vcs", "url": "https://git.toph.so/toph/kimea-plugin-heatmap" }
    ],
    "require": {
        "kimai-plugin/heatmap-bundle": "^1.0"
    }
}
Then rebuild your image or run composer install in the container.
Development
Requires Nix:
nix develop
process-compose up  # starts MariaDB + Kimai
npm test            # run JS tests
License
MIT